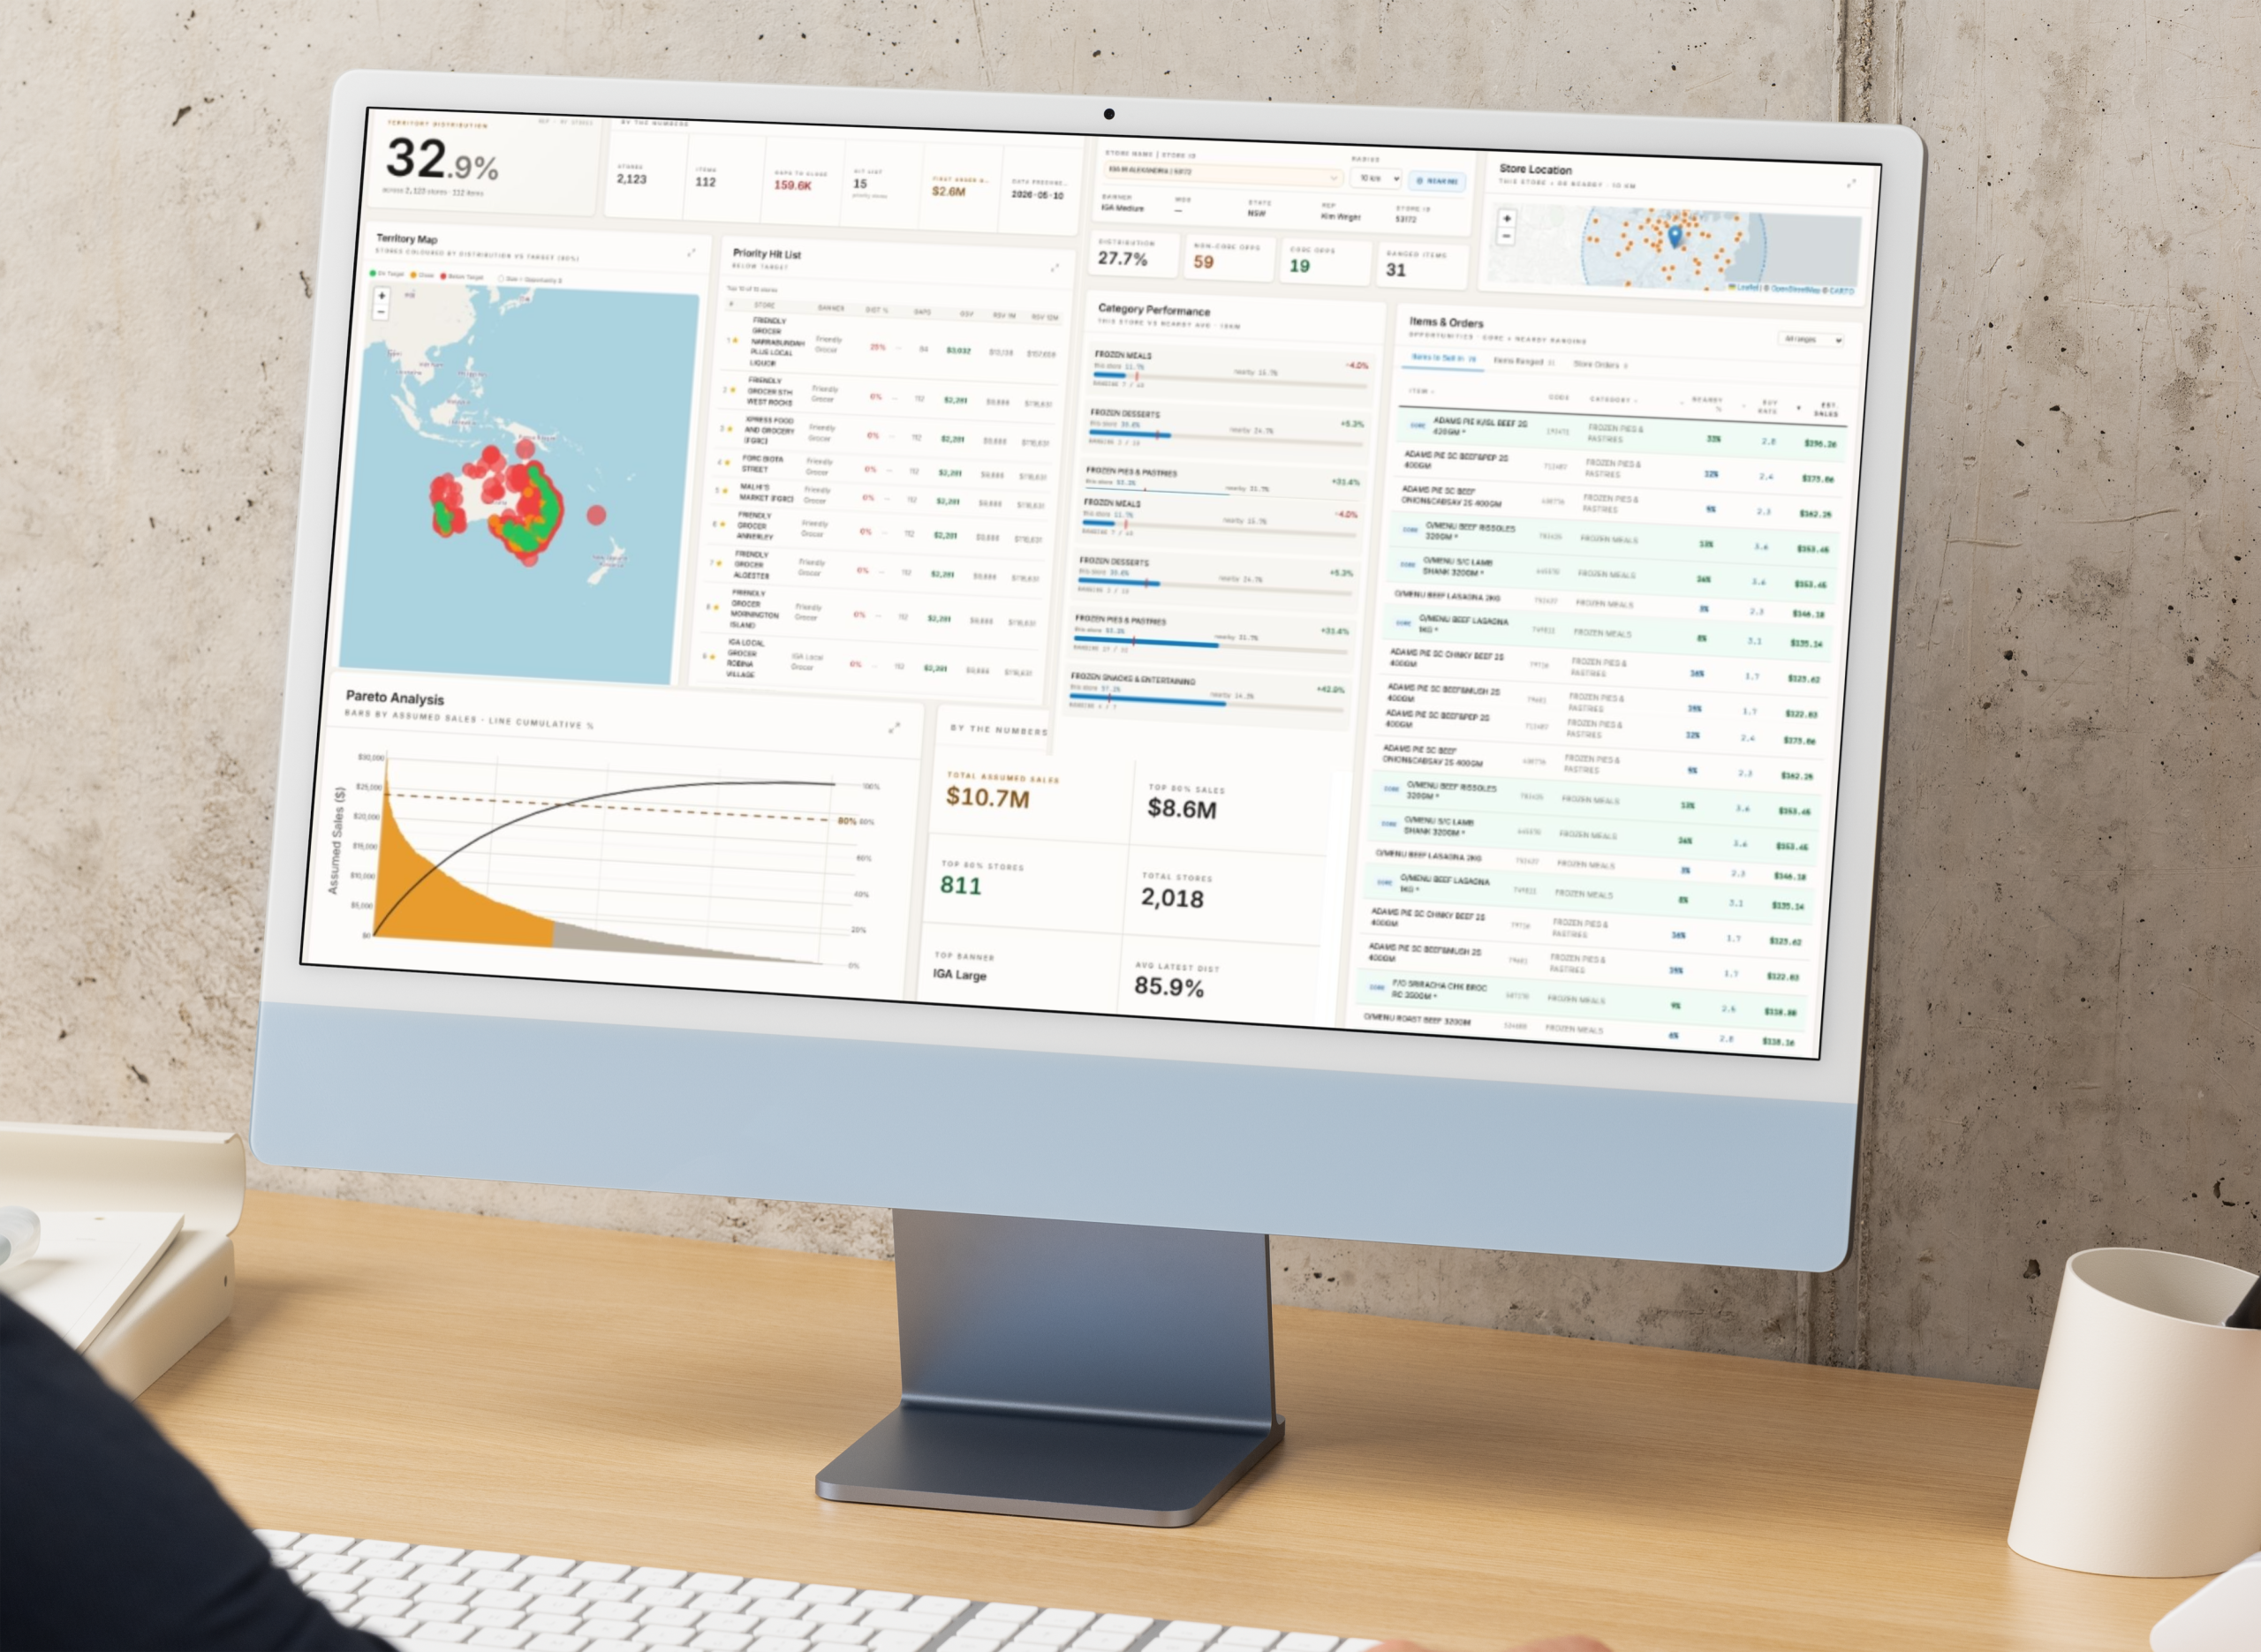
Not all distribution gaps are created equal.
Independents are one of the most expensive channels in the world to service, and the hardest to see into.
Thousands of stores. Different ranging in every one. Inconsistent call cycles, and plenty of stores that only see a rep every few weeks, or even months. Every hour you put into the channel costs money. Compared to major FMCG retailers, independents are a genuine data blind spot. Even a simple question like “is my product ranged in this store?” can be impossible to answer without physically sending someone in store to check.
That makes deciding where to send your field team, and what they should focus on when they get there, incredibly important.
A busy field team isn’t necessarily an effective one.
Field resource is never unlimited, particularly in independents. The answer can’t simply be to visit more stores or spend more hours in the channel. It’s to put reps into the stores where they can make the biggest difference, and give them something useful to act on once they’re there.
Consider the same SKU missing from two different stores. One is a small, low-turnover store. The other is a high-volume store with significantly greater sales potential.
Those distribution gaps might look identical on a report. Commercially, they’re anything but.
A gap isn’t an opportunity until you know what it’s worth
A distribution gap on a SKU in a small, low-turnover store clearly isn’t worth the same as the identical gap in a high-volume store. Without the data to separate the two, they end up getting exactly the same level of attention. You can have a rep chasing a $50 opportunity while a $500 opportunity sits untouched somewhere else.

dist·ROI puts a dollar value on the opportunity in every store.
To tackle this problem, we’ve created a market first tool called dist·ROI.
dist·ROI pulls together everything we know about a store to answer simply: where are the opportunities, and what are they worth?

Turning fragmented data into field intelligence
Most businesses aren’t short of data. The problem is that it’s often scattered across different systems, reports and datasets; and rarely joined together in a form a rep can actually use.
So instead of telling a manager a store “has 12 distribution gaps” or “could perform better”, dist·ROI names which products should be ranged, which ones aren’t, and what closing those gaps is realistically worth.
Our tool brings together fragmented reports across sales and distribution data, image recognition, SKU-level rates of sale and value, store sizes, fixture space allocations and on-shelf availability, and combines them into one, consolidated report that’s easy to understand and interpret.
Under the hood, dist·ROI is comparing what’s actually on shelf (from store purchase and distribution data) against what a store of that size should be able to carry, using each store’s bay count and IGA’s expected planogram. Run weekly across the store × item universe, that comparison becomes a single number for every SKU in every store: ranged, or a gap.
Showing sales managers and reps which stores, and which SKUs are worth the next visit.
Instead of arriving with the same checklist for every store, dist·ROI arms
managers and reps with the information to know where opportunities are before they walk through the door.
There’s less time treating every store and every distribution gap equally, and more time on the opportunities that genuinely move sales. It opens up the door to which SKUs to talk about, the likely upside, and how this store compares with similar stores that already carry those products, which completely changes the retailer conversation.
Rather than “we’d really like you to range this line”, the rep can have a much more commercially relevant discussion:
“Stores similar to yours that range this product are selling around $X a week. Based on your store, we think there’s an opportunity here worth around $Y.”

The conversation is no longer about asking the store to find room for another SKU. It’s about showing them what they could potentially sell; that’s where it earns its keep in the field.
From head office insight to action in store
The same intelligence is presented differently depending on who’s using it:
- Territory View gives reps and sales managers every store in a rep’s patch, ranked by ranging gap and dollar opportunity.
- Store Insights drills down into an individual store’s missing SKUs, plus what similar stores nearby are ranging and selling.
At head office, the data rolls up into weekly trend, Pareto and first-order opportunity views, alongside export-ready reporting and AI-generated reporting.
It means everyone is working from the same intelligence, but seeing it in a way that helps them decide what to do next.
Helping our clients save time and money with dist·ROI
dist·ROI has already become integral to the CROSSMARK team’s day to day:
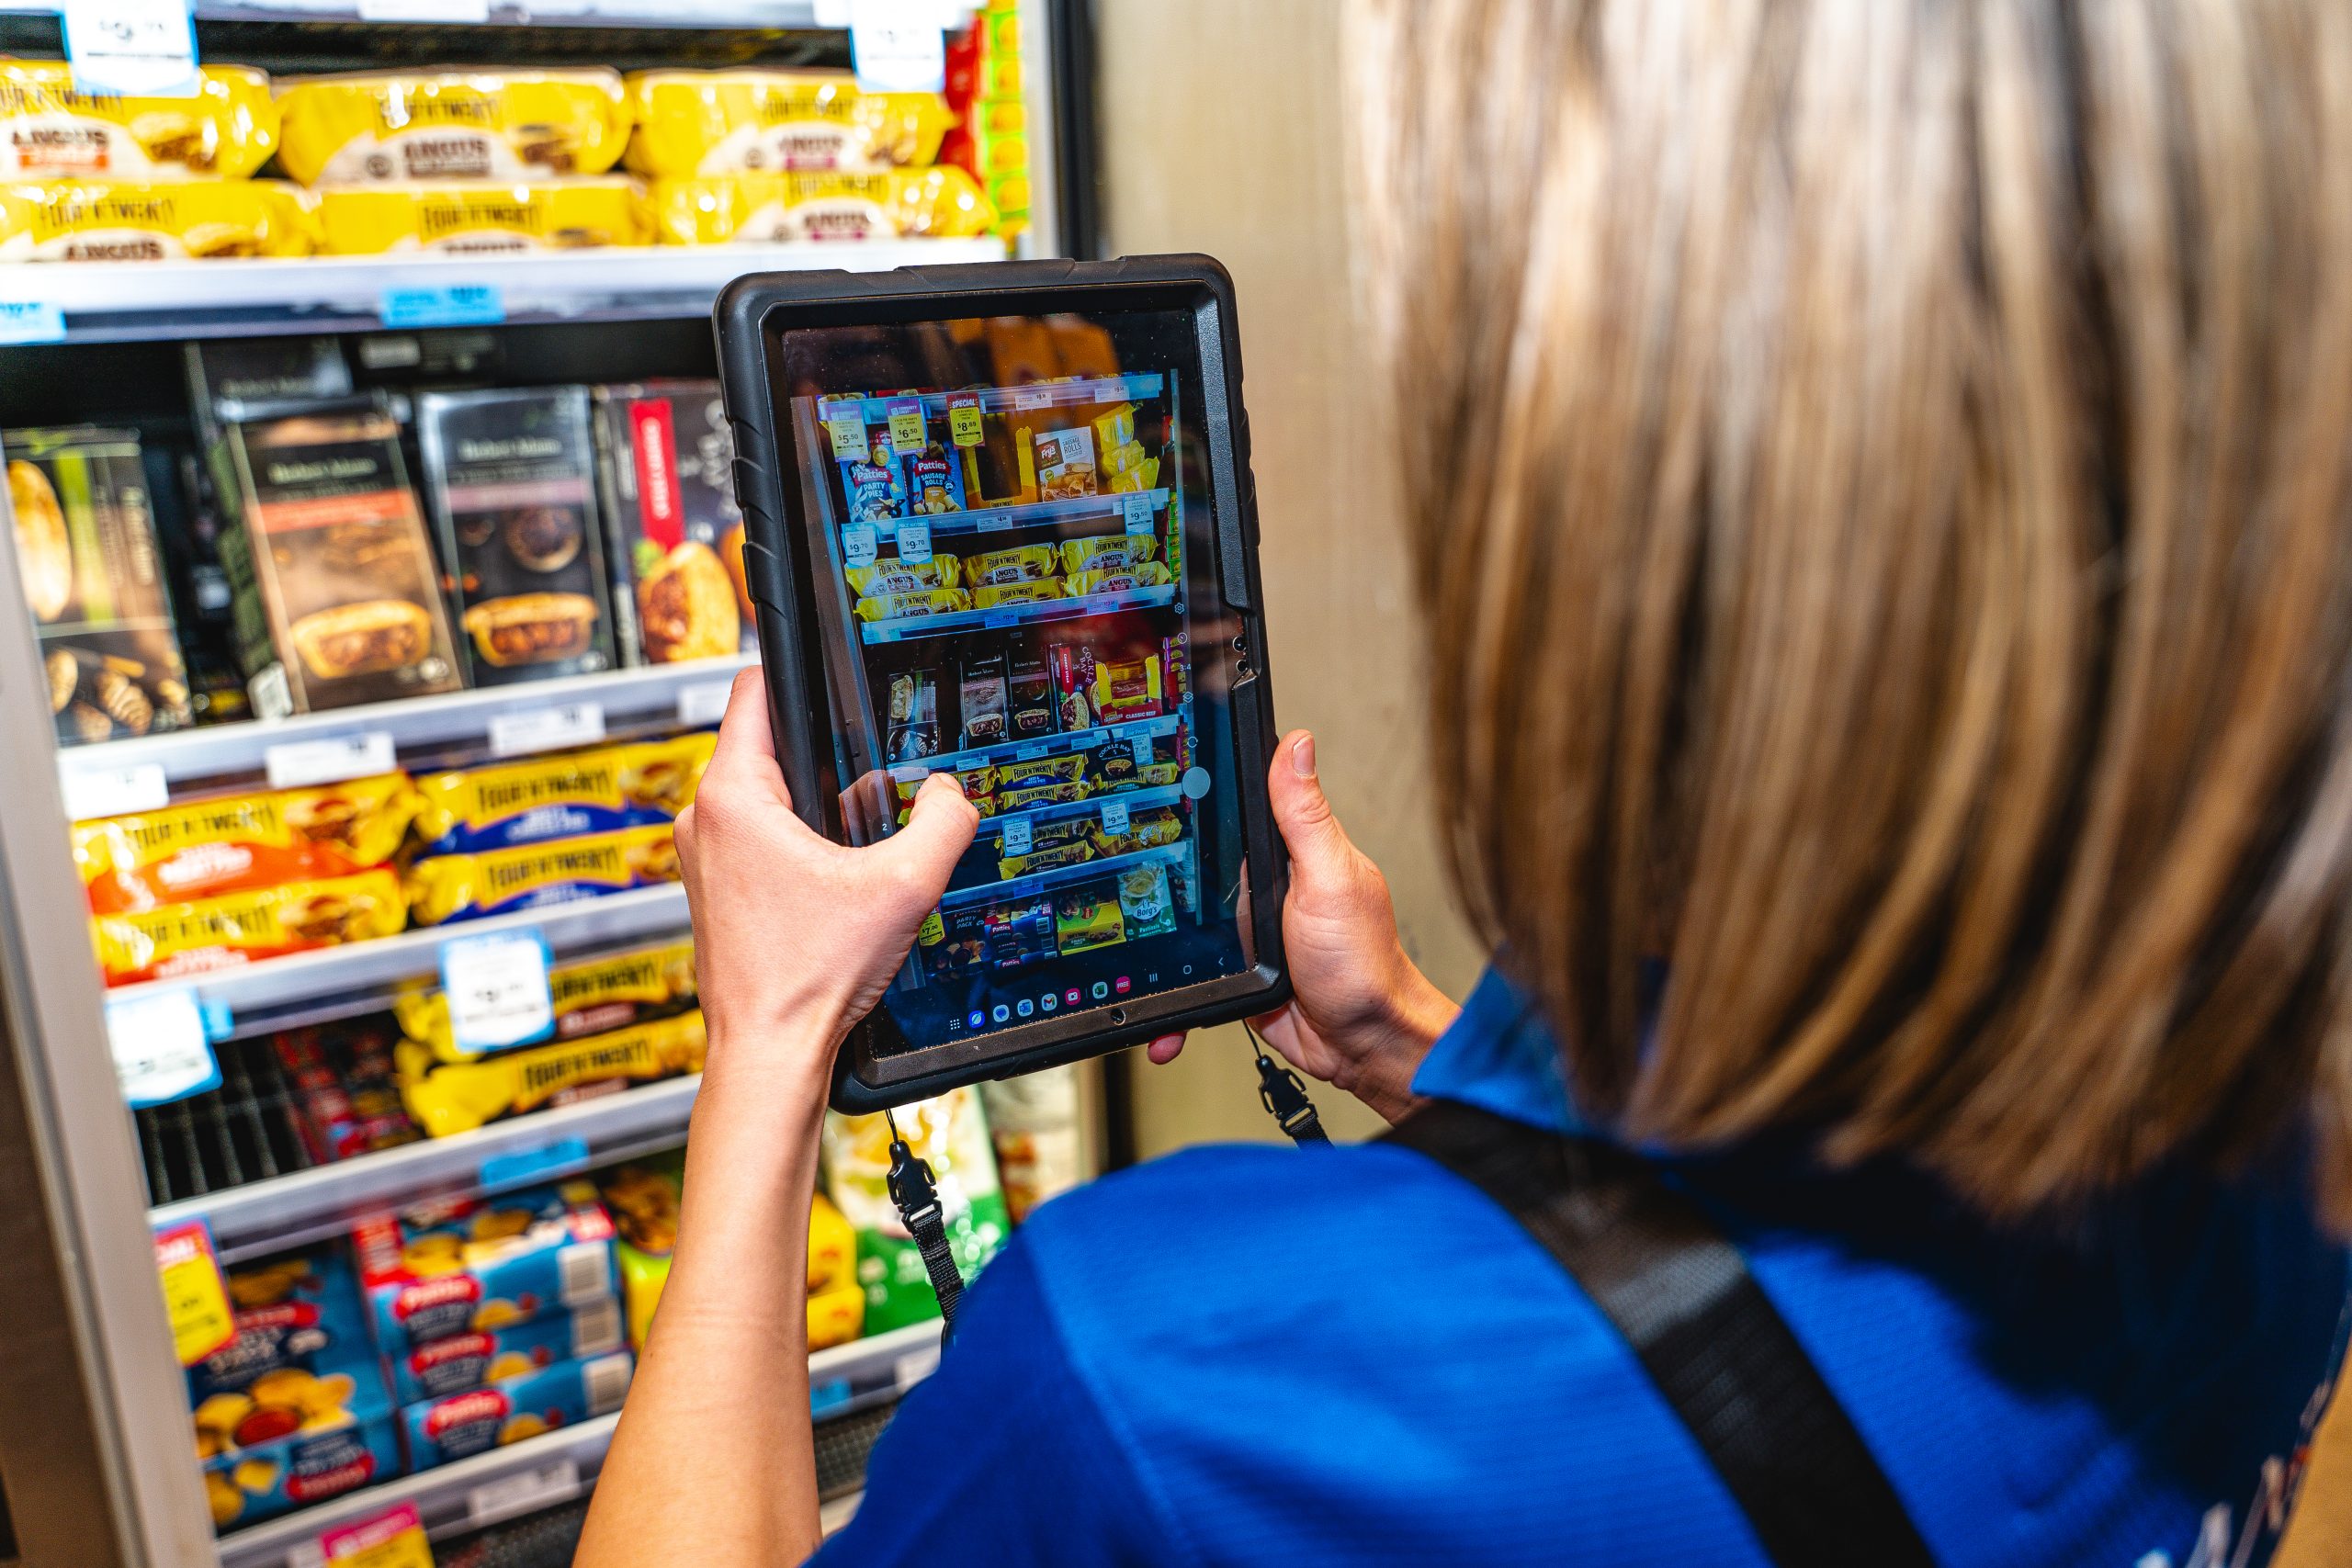
“It’s quickly become a daily tool, used for pre-planning, while in store during visits and for follow up after visits have been completed.
Particularly helpful for me where I don’t do a lot of EDI, is the ability to check back and see if stores have ordered sold in lines. This has been eliminating the need to visit again to check, in some cases, therefore allowing me to move on to other stores to complete distribution sell in.
It’s also super helpful in remaining focussed in store – now I can target exactly what is missing and it has saved me a considerable amount of time.”
Carmen – Independent Grocery rep, South Australia
About dist·ROI
dist·ROI is CROSSMARK’s distribution and ranging intelligence platform for FMCG field sales teams calling on independent and IGA-aligned grocery. It combines store purchase data, store size and category planograms to create a weekly view of ranging opportunity – delivered to head office through reporting and to the field as a prioritised action list.